
Commercial solar return on investment: costs and payback

Commercial solar systems in Australia typically pay back in 3-7 years. To estimate your commercial solar return on investment in Australia, divide the net upfront investment by the annual net operating savings; the result is the simple payback period. Your actual outcome depends on factors such as electricity use, generation and installation costs.
It’s sensible to look beyond a headline payback figure. A commercial solar proposal only makes sense when estimated generation and bill savings align with how your business uses electricity.
This guide explains how to calculate payback and assess return on investment, then compare proposals on a like-for-like basis. You’ll also learn how system costs, incentives, electricity rates and self-consumption affect the figures, helping you judge the financial case more clearly.
Table of Contents
How do I calculate commercial solar payback?
Divide the net upfront investment by annual net operating savings to estimate simple payback. Australian commercial systems typically pay back within 3-7 years, though project results vary.
Commercial solar payback calculations
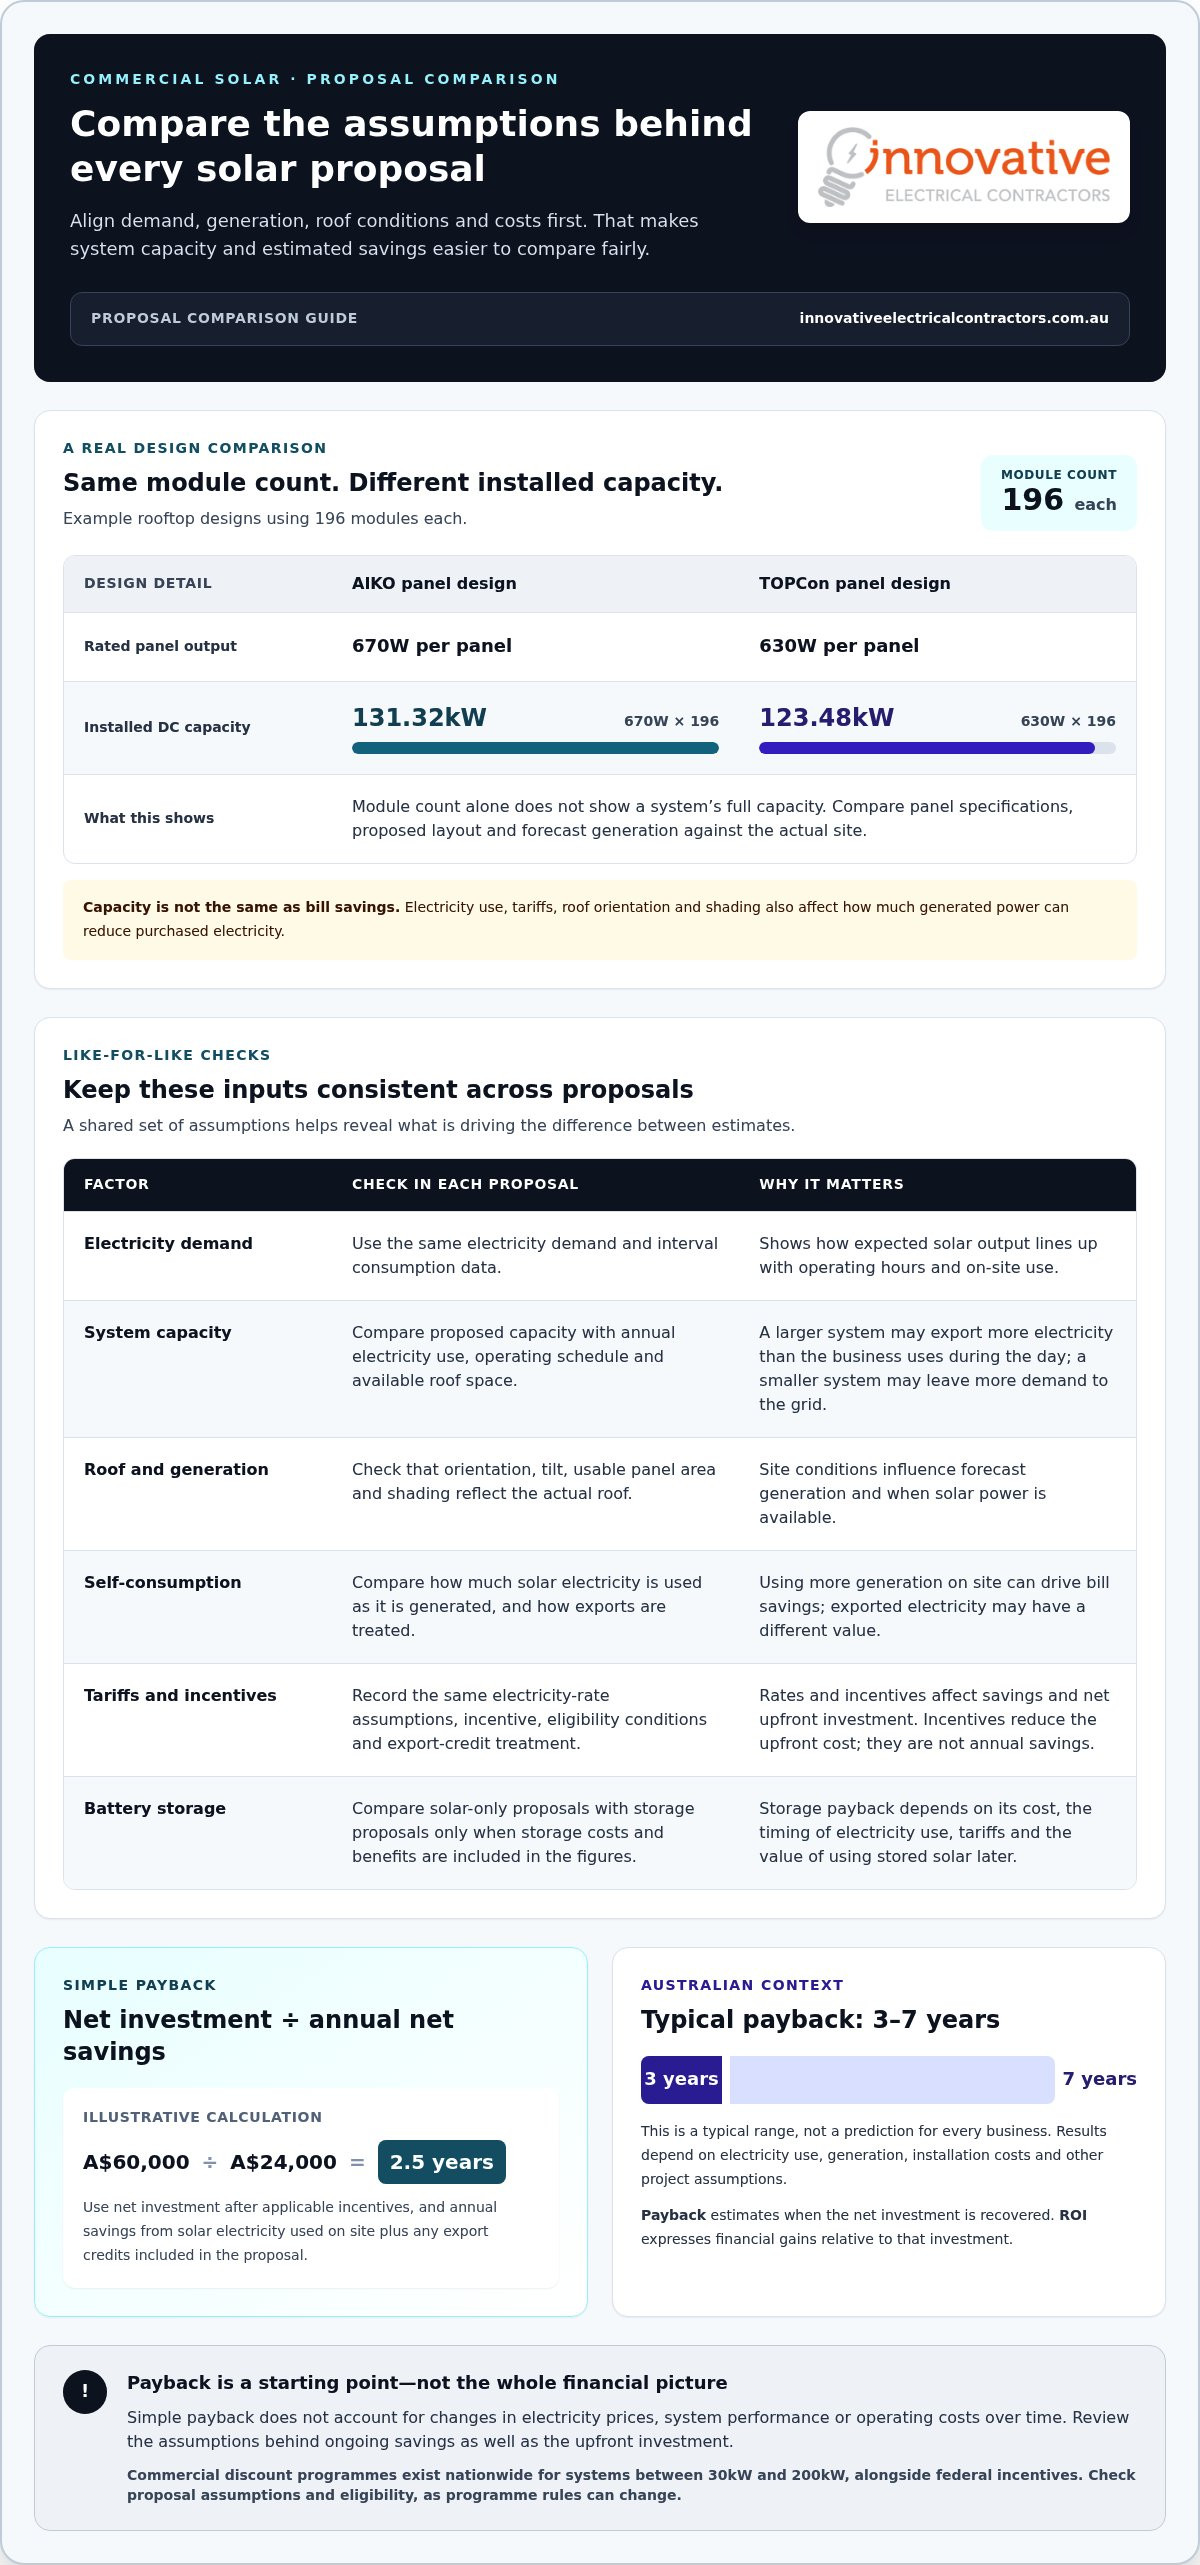
Simple payback is the net upfront investment divided by annual net operating savings. It estimates how long savings will take to recover the initial outlay, making it a useful starting point for a business decision with Innovative Electrical Contractors.
For example, a A$60,000 net investment and A$24,000 in annual savings produce a 2.5-year payback. Use the net investment after applicable incentives, rather than the gross system cost. Estimate savings from solar electricity your business uses, plus any export credits included in the proposal.
Keep the calculation consistent: compare annual savings with annual investment costs, and include storage only when its costs and benefits are reflected in the figures. Simple payback is not the full financial picture because it doesn’t account for changes in electricity prices, system performance or operating costs over time.
Estimated payback periods and ROI
Payback measures the time needed to recover the net investment, while return on investment (ROI) expresses financial gains relative to that investment. Both help assess a proposal, but they answer different questions.
Commercial solar systems in Australia typically have payback periods of 3-7 years. One illustrative example reports a five-year payback, while a separate commercial solar ROI example calculates a 20% return per year. Treat these as examples, not a prediction for every business.
Australian commercial solar systems typically have a return on investment of 4 to 7 years, according to the market estimates in this guide. That period can differ depending on exact location, system size, installation costs, electricity rates, incentives and energy use which all affect savings. A shorter payback means the initial investment is recovered sooner; ROI helps show the return beyond that point.
National and territory incentives
Commercial solar ROI and incentives vary across Australia because electricity rates, generation conditions and territory support differ. These factors affect both the net upfront investment and the value of electricity the system offsets.
Various commercial solar discount programs exist nationwide for systems between 30kW and 200kW, alongside federal incentives that can also affect eligible installations. Compare the incentives relevant to the site and system, then use the resulting net investment in the payback calculation.
For a fair comparison, record each proposal’s assumed incentive, eligibility conditions and treatment of exported electricity. Don’t count an incentive as annual savings: it reduces the upfront investment, while bill savings accrue as the system operates. Government programs and eligibility rules can change, so outdated assumptions may distort the result. A clear calculation also helps weigh sustainability goals against the business’s financial priorities.
How should businesses compare commercial solar proposals?
Compare proposals using the same electricity demand, roof conditions and tariff assumptions. This makes differences in system size and estimated annual generation easier to assess.
Consumption patterns and tilt assumptions
Consumption patterns show when a business uses electricity, while panel tilt affects when rooftop systems generate it. Both influence how much solar power can be used on site.
Commercial batteries add equipment costs compared with solar-only systems. Their payback depends on storage costs, the timing of electricity use, tariffs and the value of using stored solar power later.
Use interval consumption data to compare expected solar output with operating hours. A business that uses more electricity during daylight can use more generation directly. If consumption peaks outside solar hours, compare how each proposal accounts for exports or battery storage. Check that tilt and orientation assumptions reflect the actual roof, rather than relying on a generic model.
System size and business suitability
System size is the installed generation capacity, expressed in kilowatts, and should suit both the site and its electricity demand. A system larger than daytime use may export more electricity, while a smaller one may leave more demand to be met by the grid.
Compare proposed capacity with annual electricity use and the business’s operating schedule. For example, a warehouse with daytime equipment demand has a different load profile from a business that uses most electricity after hours. Roof area, usable panel space and shading also constrain suitable capacity.
There’s no single system size that suits every business. Compare how each proposal links capacity to consumption, available roof space and expected generation. These factors also shape financial returns: generation that coincides with demand can offset more purchased electricity.
Panel type and orientation
Panel type identifies the technology and rated output used in a design, while orientation describes the direction the panels face on the roof. These details help explain differences in capacity and forecast generation.
For a 196-module rooftop design, 670W AIKO panels provide 131.32kW DC capacity. A 630W TOPCon design with the same module count provides 123.48kW DC capacity. That comparison shows why module count alone doesn’t tell the full story.
Roof size, orientation and shading affect a commercial solar system’s electricity generation. Compare the proposed layout and panel specifications, then check how the forecast accounts for site conditions. A higher rated capacity doesn’t by itself mean greater bill savings: electricity use and tariffs also matter.
Sizing, generation and financial returns
System sizing connects installed capacity with expected energy production and the share a business can use. It matters because annual generation creates bill savings only when it offsets electricity purchases or earns export credits.
To compare forecasts, check the proposed system size, annual output and assumptions about self-consumption. Then relate estimated solar use to the business’s tariffs. Expected returns depend on location, roof orientation, shading, electricity rates and consumption patterns.
These factors affect system sizing, generation and financial returns across Australian sites. Compare each proposal using the same operating data and site assumptions; otherwise, differences in forecasts may reflect different inputs rather than better system performance. A clear review of commercial solar and battery options can help connect system design with business energy needs.
Commercial solar installation costs
Commercial solar installation costs shape the net investment, but a headline total can conceal important differences. A proposal should separate panels, inverters, mounting equipment, electrical work, labour and battery storage. For a sound financial comparison, match each component against the same system size and scope. A lower total may reflect different equipment or exclusions, rather than better value.
Compare inclusions line by line. Check whether the proposed commercial solar system includes connection work, monitoring equipment and any roof-specific requirements. Note whether battery storage is listed separately. These details show what the quoted project covers and help prevent unlike proposals from distorting your decision. They also clarify which costs relate to solar generation and which support storage.
Businesses may be able to access incentives that reduce the upfront cost of a commercial solar installation. The discount can reduce the upfront amount used in a payback calculation. Assess eligibility and the program’s effect on the proposal’s net investment, rather than treating the discount as ongoing bill savings.
The Australian Government announced an intended expansion of the Small-scale Renewable Energy Scheme to eligible solar systems up to 1MW from 1 October 2026, subject to final regulations. The proposed expansion could lower upfront installation costs for commercial, industrial and agricultural projects by around 20%. Treat an incentive as a reduction to project investment, then model annual savings separately.
The Small-scale Renewable Energy Scheme provides monetary rebates that reduce eligible solar installation costs. Include applicable incentive assumptions when comparing proposals, since they change the net investment and therefore the payback estimate. Keep the gross project scope visible alongside any incentives.
Tax deductions and depreciation are separate from solar bill savings and government incentives. Their treatment depends on the business’s tax circumstances and the asset’s classification, so show after-tax assumptions separately from the system’s operating forecast. This distinction clarifies how the commercial solar system affects cash flow and the wider financial position without counting the same benefit twice.
Solar energy can reduce reliance on grid electricity by offsetting power used on site. This can make part of energy costs more predictable, although the value depends on generation, consumption timing and tariffs. Compare projected savings with the business’s electricity use, then consider how much daytime demand the system can serve. This links installation scope to energy independence and operating costs.
Assess the investment as a complete package: equipment, labour, incentives, energy savings and storage requirements. A proposal with batteries, for example, has a different cost structure from a solar-only design, and its financial case depends on when stored electricity is used. Comparing these elements separately shows how each affects the net investment and the system’s potential to reduce electricity costs.
Generation, self-consumption and electricity bill savings
Solar bill savings depend on how much a system generates and how much electricity a business uses on site. A 100kW Victorian system can generate approximately 130,000-140,000kWh annually.
Solar output and bill offsets
Solar output is the electricity generated by installed panels and converted for use through an inverter. It matters because electricity used on site can offset power otherwise purchased from the grid.
The Australian Government states that 1kW of installed solar capacity can generate an average of 3.5-5kWh per day in Australia, depending on conditions. Actual output varies with location, roof orientation, shading and system design. Compare annual generation estimates using the same site details.
For a Victorian business with a A$50,000 annual electricity bill, a 100kW system could save A$25,000-A$35,000 per year. This estimate shows how solar output can translate into bill savings, but the offset depends on when the business uses electricity.
Self-consumption and bill savings
Self-consumption is the share of solar electricity a business uses as it is generated. It matters because directly used solar power reduces the amount of electricity purchased at the applicable retail rate.
Compare the business’s consumption schedule with expected solar generation. For example, a Victorian business with a A$40,000 annual bill could save A$24,000 per year if solar offsets 60% of its electricity costs. This illustrates how the share of usage covered can shape annual savings.
Businesses can increase self-consumption by aligning electricity use with peak solar generation hours. Running suitable equipment during those hours can use more generated power on site. If demand falls outside daylight hours, the business may export more electricity or consider storage, each with different financial effects.
Electricity rates and feed-in tariffs
Electricity rates determine the value of solar power used on site, while feed-in tariffs credit eligible electricity exported to the grid. Comparing both rates matters because exported power may be worth less than avoided grid purchases.
From July 2025, Victoria no longer mandates minimum feed-in tariffs. Businesses should therefore assess export credits in their own tariff arrangements rather than treating exports as equal in value to self-consumed electricity.
Model savings by separating on-site use from exported generation. For example, apply the business’s import tariff to solar electricity consumed directly, then account for exports using the relevant feed-in credit. This gives a clearer estimate of the effect on the bill.
Protection from rising electricity prices
Solar can reduce exposure to rising electricity prices by offsetting some grid purchases with power generated on site. The value depends on how much solar electricity matches the business’s consumption.
For a business that uses most of its electricity during daylight hours, higher self-consumption can mean more purchases avoided at prevailing tariffs. A business with evening-heavy demand may rely more on grid electricity unless it uses storage. The operating schedule therefore affects how much exposure to price changes is reduced.
Compare annual savings using the proposal’s tariff assumptions, then consider how changing electricity prices could affect future bills. Solar generation can make part of energy use less dependent on grid purchases, but the remaining bill still reflects imported electricity, network charges and the value of exported power.
Commercial solar return on investment
ROI shows the annual return relative to the upfront investment. Divide annual net financial savings by net investment, then multiply by 100. For example, A$10,000 invested and A$2,000 net profit annually produce a 20% annual ROI. This percentage complements payback periods: it helps show the scale of the return, not just when costs are recovered. Assessing commercial solar return on investment in Australia means considering both measures.
Australian commercial solar installations are usually repaid within three to five years. That broad range is a starting point, not a substitute for modelling a site’s electricity use, tariffs, generation and incentives. A 30kW commercial solar system in Sydney has an estimated payback of 3.5-4.5 years and 25% annual ROI. A 50kW system there has an estimated 28% annual ROI.
Real project examples show why business conditions matter. A Melbourne manufacturing facility with a 150kW solar system and 100kWh battery reduced annual electricity costs from A$75,000 to A$28,000, with ROI achieved in 3.8 years. A regional Victorian warehouse with a 200kW system achieved ROI in 4.2 years. These examples connect system output and business demand with financial results.
A suburban retail centre’s 80kW solar system reduced electricity costs by 55%, with complete payback projected within five years. The advantage comes from matching generation to on-site use, not simply installing more solar panels. Retail operations with daytime demand may use more generated electricity directly, while different operating schedules can produce different savings.
ROI calculations become more complex when they include batteries, changing tariffs, export credits, incentives and future operating costs. Keep each assumption visible. Separate the upfront net investment from annual savings, and distinguish electricity used on site from exported power. This avoids overstating returns by counting an incentive and the same benefit again as annual income.
For a stronger decision, compare the expected return over the system’s operating life, not only its initial payback period. Quality commercial solar systems are said to last 25-30 years, while actual financial performance depends on generation, maintenance, energy use and electricity prices. Durable panels and inverters can help maintain returns over decades. This longer view is central to commercial solar return on investment in Australia.
Review your business’s load profile and proposal assumptions before committing to a system. Discuss a commercial solar installation that aligns system design with your site’s electricity needs.
Innovative Electrical Contractors: Commercial Electrical
Innovative Electrical Contractors provides commercial electrical and solar and battery services for businesses assessing a commercial solar project. Turn to the team when you’re ready to move from reviewing payback assumptions to planning the electrical work and solar installation your site may need.
Each project’s energy use, operating schedule and site requirements shape the system decision. A business exploring off-grid power can also consider off-grid solar, battery and generator options as part of its energy planning. Matching the solution to your operating needs keeps the project focused on practical requirements, not just a headline return.
For commercial electrical and solar work, visit Innovative Electrical Contractors.
Plan your next energy decision
A solar investment can shape more than the next electricity bill. Consider how your business may change, including new equipment, operating hours or plans for greater energy independence. Those needs can influence whether a solar-only design, storage or an off-grid setup best fits your longer-term plans.
Assessing commercial solar return on investment in Australia is most useful when the financial model reflects how your site actually operates. Treat the figures as a planning tool, then connect them to your business’s electrical requirements and energy priorities.
Innovative Electrical Contractors works across Commercial Electrical and Electrical Services, and offers off-grid solar, battery and generator solutions. If you’re ready to explore how these options relate to your site and business goals, contact Innovative Electrical Contractors to discuss the next step.
A considered decision today can help your business plan its energy use with greater clarity. Take the time to choose an approach that fits the work ahead.
Frequently Asked Questions
Do higher-efficiency solar panels improve commercial solar ROI in Australia?
They can improve the financial case when higher output fits the available roof area and business demand. For example, a design using 196 670W modules provides 131.32kW DC capacity, compared with 123.48kW for 196 630W modules. That difference represents installed capacity, not guaranteed savings. Assess expected generation, panel layout, shading and how much electricity the business can use during daylight before judging the return.
The true cost of commercial solar panels: is it worth the investment?
Commercial solar is worth assessing against the electricity costs it can offset and the project’s net investment. The full financial picture includes panels, inverters, labour, electrical work and any storage, alongside applicable incentives. A business with substantial daytime electricity use can directly use more generated power. Compare estimated savings with the project’s complete scope, rather than judging value from panel cost alone.
What is the typical payback period for commercial solar in Australia in 2026?
Commercial solar systems in Australia typically have payback periods of 3-7 years. For a more specific comparison, a 30kW commercial system in Sydney is estimated to pay back in 3.5-4.5 years. These are different reference points, not interchangeable guarantees. A business should assess its own net investment, annual savings, operating schedule and expected generation when considering the 2026 payback outlook.
How much does a commercial solar system cost per kW in Australia?
There isn’t one cost per kW that represents every Australian project. This calculation divides project cost by system capacity. Roof conditions, equipment, labour and project scope affect the quote, so a Victorian reference shouldn’t be treated as a national price.
What ROI and annual savings can Australian businesses expect from commercial solar?
Returns depend on the relationship between the net investment and the electricity costs the system offsets. A Sydney manufacturing facility example reports a 31.5% internal rate of return for a 100kW system. IRR is a different measure from simple annual ROI, so don’t compare the percentages as if they were identical. Review each model’s timeframe, self-consumption assumptions and treatment of exported electricity.
How do electricity tariffs, demand charges and solar self-consumption affect commercial solar payback?
Self-consumption affects how much solar generation replaces electricity purchased from the grid. Tariffs determine the value of that avoided purchase, while export credits apply to surplus electricity sent to the grid. Demand charges are a separate bill component, so their effect depends on the business’s tariff structure and peak demand. Compare interval usage with generation forecasts to see when solar offsets imports and whether peak loads coincide with sunlight.
What commercial solar rebates, grants or incentives are available in Australia, including the Small-scale Technology Certificate scheme?
Eligible Australian solar systems up to 100kW can receive Small-scale Technology Certificates. The Australian Government announced an intended expansion of the Small-scale Renewable Energy Scheme to eligible systems up to 1MW from 1 October 2026, subject to final regulations. In Victoria, the Victorian Energy Upgrades program offers businesses up to A$34,300 in upfront discounts for commercial solar installations between 30kW and 200kW.
What are the main risks, maintenance costs and warranties for commercial solar in Australia?
Performance risks include generation assumptions that don’t reflect roof shading, orientation or the business’s consumption schedule. Regular solar panel maintenance helps prevent efficiency losses and protect the investment over time. Quality commercial solar systems are said to last 25-30 years, while solar system warranties are 20 years or more. Include maintenance requirements and warranty terms in financial planning, and keep system performance records to track output against forecasts.
Comments